Stops
Downloads + Imports


Read and format data
%time stops_df = pd.read_csv(zipfile.open('stops.txt'))
stops_df.tail()
stops_df.info()
CPU times: user 107 ms, sys: 7.92 ms, total: 115 ms
Wall time: 115 ms
<class 'pandas.core.frame.DataFrame'>
RangeIndex: 41914 entries, 0 to 41913
Data columns (total 11 columns):
# Column Non-Null Count Dtype
--- ------ -------------- -----
0 stop_id 41914 non-null object
1 stop_code 0 non-null float64
2 stop_name 41914 non-null object
3 stop_desc 0 non-null float64
4 stop_lat 41914 non-null float64
5 stop_lon 41914 non-null float64
6 location_type 41914 non-null int64
7 parent_station 28752 non-null float64
8 wheelchair_boarding 9101 non-null float64
9 platform_code 4436 non-null object
10 zone_id 15369 non-null object
dtypes: float64(6), int64(1), object(4)
memory usage: 3.5+ MB
stops_df.fillna('', inplace=True)
stops_df = stops_df.drop(['stop_code', 'stop_desc'], axis=1)
stops_df.loc[stops_df["wheelchair_boarding"] == '','wheelchair_boarding'] = 0
stops_df_multiple_stops = stops_df.copy()
stops_df.drop_duplicates(subset=['stop_name', 'location_type', 'wheelchair_boarding', 'platform_code'],keep='first', inplace = True)
stops_df.head()
| stop_id | stop_name | stop_lat | stop_lon | location_type | parent_station | wheelchair_boarding | platform_code | zone_id | |
|---|---|---|---|---|---|---|---|---|---|
| 0 | 000008012713 | Rangsdorf, Bahnhof | 52.294125 | 13.431112 | 0 | 900000245025.0 | 0 | ||
| 1 | 000008010205 | Leipzig, Hauptbahnhof | 51.344817 | 12.381321 | 0 | 900000550090.0 | 0 | ||
| 2 | 000008010327 | Senftenberg, Bahnhof | 51.526790 | 14.003977 | 0 | 900000435000.0 | 0 | ||
| 3 | 000008010324 | Schwerin, Hauptbahnhof | 53.635261 | 11.407520 | 0 | 900000550112.0 | 0 | ||
| 4 | 000008012393 | Mühlanger, Bahnhof | 51.855704 | 12.748198 | 0 | 900000550319.0 | 0 |
stops_df.apply(lambda x: x.unique().size, axis=0)
stop_id 29601
stop_name 13155
stop_lat 13107
stop_lon 13119
location_type 2
parent_station 13121
wheelchair_boarding 2
platform_code 59
zone_id 14622
dtype: int64
# visualization with folium: takes way longer + more memory consumption than bokeh
#f = folium.Figure(width=800, height=600)
#m = folium.Map(location=[45.5236, -122.6750], prefer_canvas=True).add_to(f)
#for lat, lon in zip(stops_df['stop_lat'], stops_df['stop_lon']):
# folium.CircleMarker(
# location=[lat, lon],
# radius=1,
# color="#3186cc",
# fill=True,
# fill_color="#3186cc",
# ).add_to(m)
#m
def merc_from_arrays(lats, lons):
r_major = 6378137.000
x = r_major * np.radians(lons)
scale = x/lons
y = 180.0/np.pi * np.log(np.tan(np.pi/4.0 + lats * (np.pi/180.0)/2.0)) * scale
return (x, y)
p = figure(plot_width=800, plot_height=700,title="Public Transport Stops of VBB",tools="pan,wheel_zoom",
x_range=(1215654.4978, 1721973.3732), y_range=(6533225.6816, 7296372.9720),
x_axis_type="mercator", y_axis_type="mercator",
tooltips=[("Name", "@stop_name"), ("platform", "@platform_code"), ("(Lat, Lon)", "(@stop_lat, @stop_lon)")])
p.add_tile(get_provider(OSM))
stops_df['merc_x'], stops_df['merc_y'] = merc_from_arrays(stops_df['stop_lat'], stops_df['stop_lon'])
p.circle(x='merc_x', y='merc_y', source=stops_df)
show(p)
hv.output(backend="bokeh")
tiles = hv.element.tiles.OSM().opts(alpha=0.5)
stops = hv.Points(stops_df, ['merc_x', 'merc_y'], label='Public Transport Stops')
stops_wa = hv.Points(stops_df.loc[stops_df['wheelchair_boarding'] == 1], ['merc_x', 'merc_y'], label='Wheelchair accessible Stops')
tiles * hd.datashade(stops) + tiles * hd.datashade(stops_wa)
Stations with most stops
stops_df_multiple_stops['stop_name'].value_counts().head(10)
S Potsdam Hauptbahnhof 26
Cottbus, Hauptbahnhof 19
Potsdam, Medienstadt Babelsberg Bhf 19
S Königs Wusterhausen Bhf 19
S Wannsee Bhf (Berlin) 18
S+U Berlin Hauptbahnhof 18
Fürstenwalde, Bahnhof 18
Potsdam, Johannes-Kepler-Platz 17
S Ostkreuz Bhf (Berlin) 17
S+U Zoologischer Garten Bhf (Berlin) 17
Name: stop_name, dtype: int64
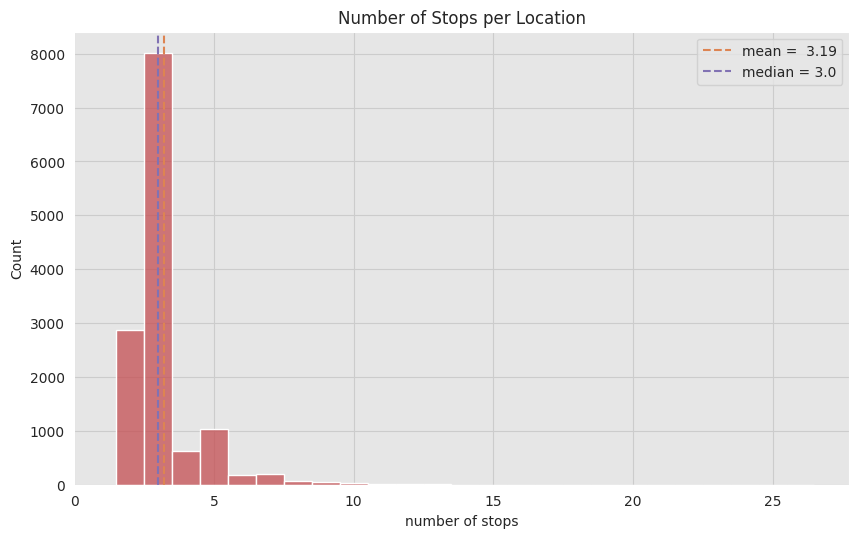
num_stops = stops_df_multiple_stops.groupby(['stop_name']).agg(num_stops=('stop_id', 'count')).query('num_stops > 1').sort_values('num_stops', ascending=False)
num_stops.describe()
| num_stops | |
|---|---|
| count | 13120.000000 |
| mean | 3.191997 |
| std | 1.318984 |
| min | 2.000000 |
| 25% | 3.000000 |
| 50% | 3.000000 |
| 75% | 3.000000 |
| max | 26.000000 |
num_stops_mean = num_stops['num_stops'].mean()
num_stops_median = num_stops['num_stops'].median()
fig, ax = plt.subplots()
sns.histplot(x='num_stops', data=num_stops, color=sns_c[3], ax=ax, discrete=True)
ax.axvline(x=num_stops_mean, color=sns_c[1], linestyle='--', label=f'mean = {num_stops_mean: ,.2f}')
ax.axvline(x=num_stops_median, color=sns_c[4], linestyle='--',label=f'median = {num_stops_median}')
ax.legend(loc='upper right')
ax.set(title='Number of Stops per Location', xlabel='number of stops', xlim=(0, None))
[Text(0.5, 1.0, 'Number of Stops per Location'),
Text(0.5, 0, 'number of stops'),
(0.0, 27.75)]
Stops per District
from io import BytesIO
from zipfile import ZipFile
from urllib.request import urlopen, Request, urlretrieve
from collections import OrderedDict
url = "https://www.suche-postleitzahl.org/download_files/public/plz-gebiete.shp.zip"
headers = {
'User-Agent': 'Mozilla/5.0 (Windows NT 10.0; Win64; x64; rv:77.0) Gecko/20100101 Firefox/77.0'
}
request = Request(url, None, headers)
resp = urlopen(request)
data = resp.read()
with ZipMemoryFile(data) as zip_memory_file:
with zip_memory_file.open('plz-gebiete.shp') as collection:
# collection.crs is {'init': dst_epsg} -> deprecated format
plz_shapes = gpd.GeoDataFrame.from_features(collection, crs=collection.crs['init'])
# plz_shapes = gpd.read_file('plz_gebiete.zip')
plz_shapes.head()
| geometry | plz | note | |
|---|---|---|---|
| 0 | POLYGON ((5.86632 51.05110, 5.86692 51.05124, ... | 52538 | 52538 Gangelt, Selfkant |
| 1 | POLYGON ((5.94504 51.82354, 5.94580 51.82409, ... | 47559 | 47559 Kranenburg |
| 2 | POLYGON ((5.96811 51.05556, 5.96951 51.05660, ... | 52525 | 52525 Waldfeucht, Heinsberg |
| 3 | POLYGON ((5.97486 50.79804, 5.97495 50.79809, ... | 52074 | 52074 Aachen |
| 4 | POLYGON ((6.01507 50.94788, 6.03854 50.93561, ... | 52531 | 52531 Ãbach-Palenberg |
plz_population = pd.read_csv('plz_einwohner.csv', dtype={'plz': str, 'einwohner': int})
plz_population.head()
| plz | einwohner | |
|---|---|---|
| 0 | 01067 | 11957 |
| 1 | 01069 | 25491 |
| 2 | 01097 | 14821 |
| 3 | 01099 | 28018 |
| 4 | 01108 | 5876 |
plz_df = pd.merge(left=plz_shapes[['plz', 'geometry']], right=plz_population, on='plz', how='left')
plz_df.nlargest(5, 'einwohner')
| plz | geometry | einwohner | |
|---|---|---|---|
| 2243 | 65428 | POLYGON ((8.35638 49.95802, 8.35666 49.95805, ... | 58826 |
| 471 | 40764 | POLYGON ((6.90571 51.11044, 6.91022 51.11426, ... | 56833 |
| 358 | 50354 | POLYGON ((6.77866 50.87839, 6.77971 50.87898, ... | 55073 |
| 43 | 52249 | POLYGON ((6.19049 50.80714, 6.19104 50.80723, ... | 54732 |
| 737 | 53757 | POLYGON ((7.12540 50.77442, 7.12591 50.77492, ... | 53997 |
stops_gdf = gpd.GeoDataFrame(stops_df, geometry=gpd.points_from_xy(stops_df['stop_lon'], stops_df['stop_lat']))
stops_gdf.set_crs(epsg=4326, inplace=True)
stops_gdf.head()
| stop_id | stop_name | stop_lat | stop_lon | location_type | parent_station | wheelchair_boarding | platform_code | zone_id | merc_x | merc_y | geometry | |
|---|---|---|---|---|---|---|---|---|---|---|---|---|
| 0 | 000008012713 | Rangsdorf, Bahnhof | 52.294125 | 13.431112 | 0 | 900000245025.0 | 0 | 1.495145e+06 | 6.853483e+06 | POINT (13.43111 52.29413) | ||
| 1 | 000008010205 | Leipzig, Hauptbahnhof | 51.344817 | 12.381321 | 0 | 900000550090.0 | 0 | 1.378282e+06 | 6.682516e+06 | POINT (12.38132 51.34482) | ||
| 2 | 000008010327 | Senftenberg, Bahnhof | 51.526790 | 14.003977 | 0 | 900000435000.0 | 0 | 1.558916e+06 | 6.715011e+06 | POINT (14.00398 51.52679) | ||
| 3 | 000008010324 | Schwerin, Hauptbahnhof | 53.635261 | 11.407520 | 0 | 900000550112.0 | 0 | 1.269879e+06 | 7.101379e+06 | POINT (11.40752 53.63526) | ||
| 4 | 000008012393 | Mühlanger, Bahnhof | 51.855704 | 12.748198 | 0 | 900000550319.0 | 0 | 1.419123e+06 | 6.774077e+06 | POINT (12.74820 51.85570) |
join_df = gpd.sjoin(stops_gdf, plz_df, how='inner', op="within")
join_df.drop(['index_right', 'einwohner'], axis=1, inplace=True)
join_df = join_df[join_df['parent_station'] == ""]
join_df.head()
---------------------------------------------------------------------------
ImportError Traceback (most recent call last)
/tmp/ipykernel_2219/347435686.py in <module>
----> 1 join_df = gpd.sjoin(stops_gdf, plz_df, how='inner', op="within")
2 join_df.drop(['index_right', 'einwohner'], axis=1, inplace=True)
3 join_df = join_df[join_df['parent_station'] == ""]
4 join_df.head()
/opt/hostedtoolcache/Python/3.8.10/x64/lib/python3.8/site-packages/geopandas/tools/sjoin.py in sjoin(left_df, right_df, how, op, lsuffix, rsuffix)
87 _basic_checks(left_df, right_df, how, lsuffix, rsuffix)
88
---> 89 indices = _geom_predicate_query(left_df, right_df, op)
90
91 joined = _frame_join(indices, left_df, right_df, how, lsuffix, rsuffix)
/opt/hostedtoolcache/Python/3.8.10/x64/lib/python3.8/site-packages/geopandas/tools/sjoin.py in _geom_predicate_query(left_df, right_df, op)
171 # see discussion at https://github.com/geopandas/geopandas/pull/1421
172 predicate = "contains"
--> 173 sindex = left_df.sindex
174 input_geoms = right_df.geometry
175 else:
/opt/hostedtoolcache/Python/3.8.10/x64/lib/python3.8/site-packages/geopandas/base.py in sindex(self)
2628 [2]])
2629 """
-> 2630 return self.geometry.values.sindex
2631
2632 @property
/opt/hostedtoolcache/Python/3.8.10/x64/lib/python3.8/site-packages/geopandas/array.py in sindex(self)
307 def sindex(self):
308 if self._sindex is None:
--> 309 self._sindex = _get_sindex_class()(self.data)
310 return self._sindex
311
/opt/hostedtoolcache/Python/3.8.10/x64/lib/python3.8/site-packages/geopandas/sindex.py in _get_sindex_class()
19 if compat.HAS_RTREE:
20 return RTreeIndex
---> 21 raise ImportError(
22 "Spatial indexes require either `rtree` or `pygeos`. "
23 "See installation instructions at https://geopandas.org/install.html"
ImportError: Spatial indexes require either `rtree` or `pygeos`. See installation instructions at https://geopandas.org/install.html
count_df = join_df.groupby('plz', dropna=False).size().reset_index(name='stop_count')
plz_df = pd.merge(left=plz_df[['plz', 'geometry', 'einwohner']], right=count_df, on='plz', how='left')
plz_df['stops_per_inhabitant'] = plz_df.apply(lambda row: np.nan if row['einwohner'] == 0 else row['stop_count'] / row['einwohner'], axis=1)
plz_df.sort_values('stop_count', ascending=False)
fig, ax = plt.subplots(figsize=(5, 5))
plz_df.plot(
ax=ax,
column='einwohner',
categorical=False,
cmap='plasma_r',
edgecolor='black',
linewidth=0.05,
legend=True
)
ax.set(
title='Population per PLZ',
aspect=1.3
);
fig, ax = plt.subplots(figsize=(5, 5))
plz_df.plot(
ax=ax,
column='stop_count',
categorical=False,
cmap='plasma_r',
edgecolor='black',
linewidth=0.1,
legend=True
)
ax.set(
title='Stops per PLZ',
aspect=1.3
);
fig, ax = plt.subplots(figsize=(5, 5))
plz_df.plot(
ax=ax,
column='stops_per_inhabitant',
categorical=False,
cmap='plasma_r',
edgecolor='black',
linewidth=0.1,
)
ax.set(
title='Stops per Inhabitant per PLZ',
aspect=1.3
);